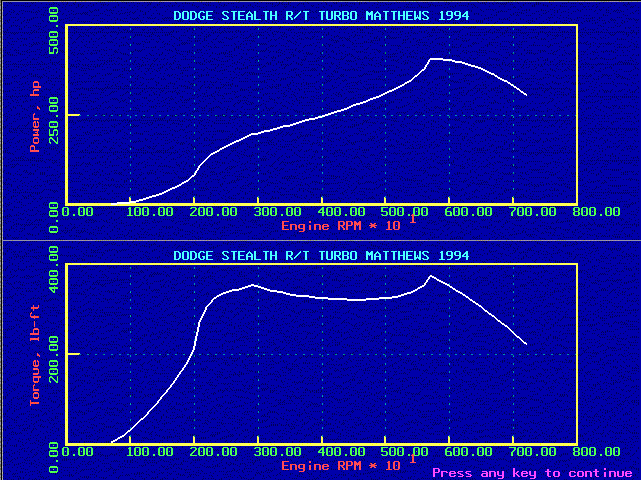
These are the horsepower and torque curves as represented by the simulator.
Compare these to the actual curves as measured on the dynomometer.
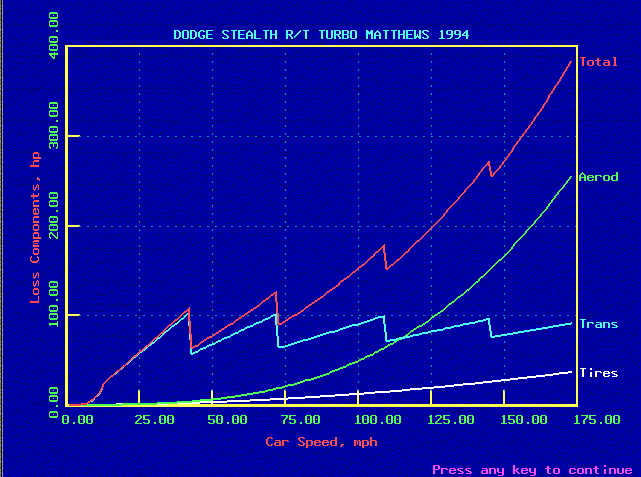
Here is the power loss according to the simulator.
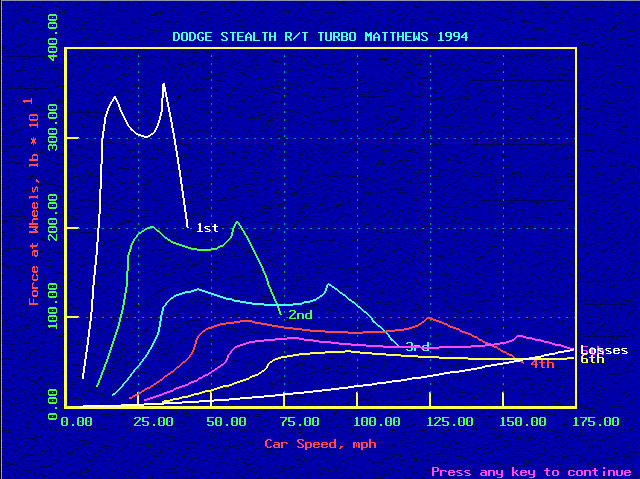
Here is the power by gear as computed by the simulator.
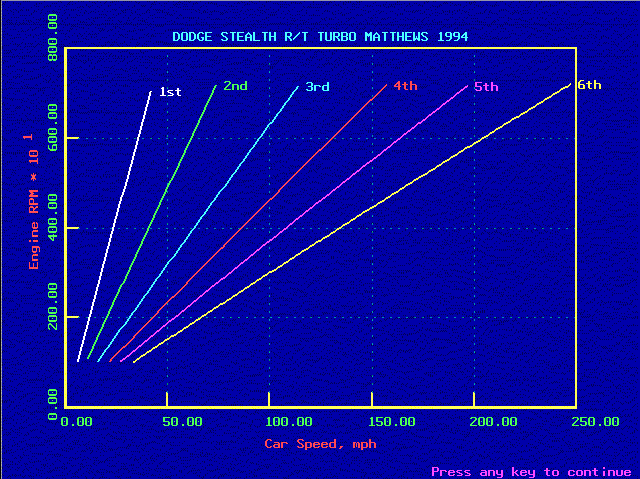
Here are vehicle speeds vs. RPM in all gears as computed by the simulator.
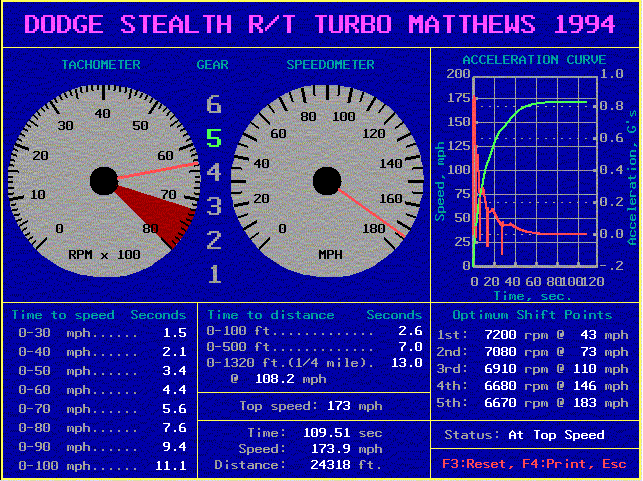
Here are the results of an acceleration simulation. These figures
are amazingly accurate and entirely plausible, as my best 0-60 is 4.79 seconds, my best 1/4 mile is
13.16 seconds, and my best top speed is 171 mph.
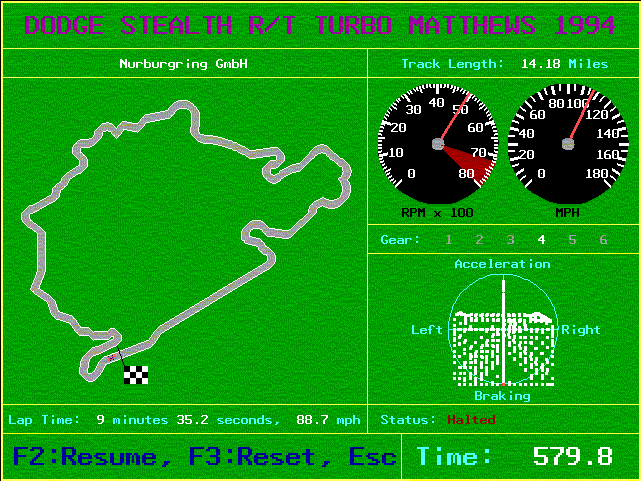
Here are the results of a track simulation
(Nurburgring was not far from where I lived in Germany).