 On
1 February 1999, Mike Chapleski and I visited Roger Gerl in Switzerland
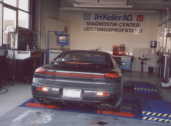
and spent the day at an all-wheel-drive dynamometer in Zurich.
Manufactured by MAHA in Germany, the Eddy current brake dyno has torque and speed sensors connected to each roller as well as Telma retarders that can hold a vehicle at specific speeds to facilitate tuning (see the LPS3000 overview for additional details). This is a far more sophisticated and accurate approach to the more common inertia dynos commonly used in the States. Regardless, dyno charts are useful only when compared to other charts produced on the same equipment using the same technique so that relative performance can be evaluated.
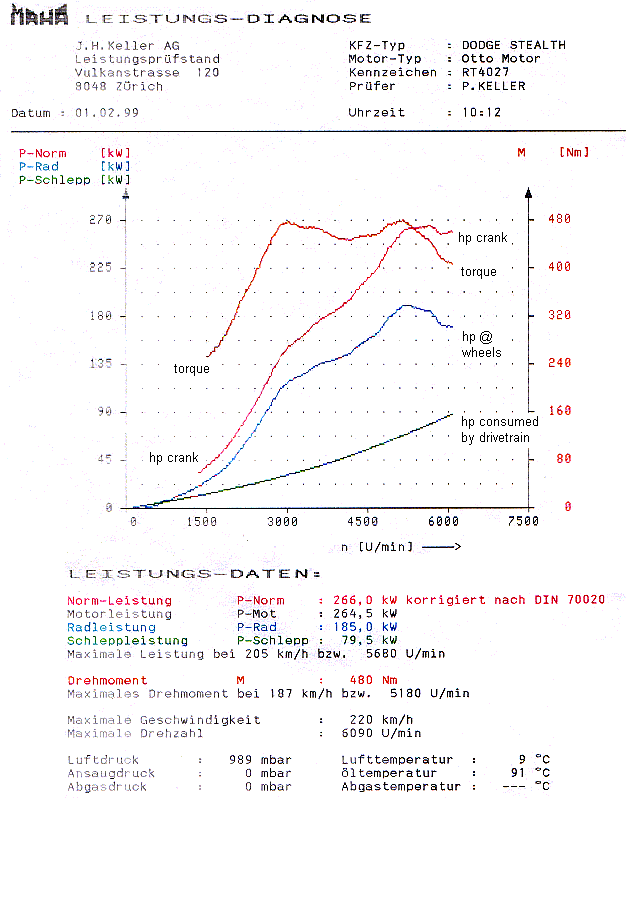
The three cars had slightly different modifications and I think the results are very interesting. First, below is the dyno sheet for my run. Keep in mind that my only engine mods are K&N FIPK, A'PEXi Super AVC-R, Magnecore wires, and plugs regapped to .034. Stock adjustable exhaust (in Sport mode), stock 9B turbos, stock fuel delivery, stock everything else. The car had 68,000 miles on the odometer at the time of the test, last tune-up at 50k miles, Exxon 93 octane fuel, and the SAVC-R was set at 1.00 kg/cm^2 @ 72% BADC, which resulted in a short overboost to 1.05 kg/cm^2, then a steady 0.99-1.00 kg/cm^2 until 6000 rpm when power began to drop off (note: 1.000 kg/cm2 = .9804 bar = 0.9678 atmospheres). This run was made in fourth gear since it is closest to direct drive (.92 on the 6-speed Getrag).

The top line is the torque curve in Newton-meters (the vertical scale on the right) as measured by the dyno at the wheels during acceleration.
The next line is the engine horsepower curve in kilowatts (the vertical scale on the left), which is computed from the torque curve using the familiar equation horsepower = torque x RPM / 5252.
The next two lines are the wheel horsepower and drivetrain loss, also in kilowatts. Note that the drivetrain loss is computed from torque as measured by the dyno at the wheels during deceleration in gear with the clutch in, and this curve is subtracted from the computed flywheel horsepower curve to produce the horsepower curve at the wheels. The top lines were rendered left to right during acceleration and the bottom lines were rendered right to left during deceleration.
Then we have the lines of text. Can't read German? Neither can I, but Roger translated.
Here's the scoop, complete with conversions into SAE units:
P-Norm is peak horsepower corrected to European DIN standards. 266 kW = 362 DIN
PS = 367 SAE HP (conversion factors are 1.36 and 1.014, respectively).
P-Mot is the peak horsepower uncorrected.
P-Rad is the peak horsepower at the wheels.
P-Schlepp is the drivetrain loss at the peak horsepower RPM.
Maximale Leistung
is the speed and RPM at which the peak horsepower was achieved (in fourth gear), 205 kph and 5680 rpm, respectively.
Drehmoment is the peak torque. 480 Nm = 354 lb-ft (conversion factor is .7375)
Maximales Drehmoment
is the speed and RPM at which the peak torque was achieved (in fourth gear), 187 kph and 5180
rpm, respectively (note that torque was almost as high at as low as 3000 RPM)
Maximale Geschwindigkeit
is the maximum speed achieved during the run, 220 kph
Maximale Drehzahl
is the maximum RPM achieved during the run, 6090 rpm
Luftdruck is the
ambiant atmospheric pressure, 989 mbar (about 1.02 kg/cm2)
Ansaugdruck is the
intake pressure (not measured)
Abgasdruck is the
exhaust pressure (not measured)
Lufttemperatur is
the ambiant air temperature, 9 degrees Celsius
Oltemperatur is the
maximum oil temperature during the run, 91 degrees Celsius
Abgastemperature
is the exhaust temperature (not measured)
Also measured during this run was air/fuel ratio (A/F ranged from 11.4 - 13.0) and intake temperature at the intersection of the two Y-pipes (107.8 degrees Celsius maximum).
Observations:
Mike Chapleski's 1995 Dodge Stealth
R/T TT (U.S. Spec)
22K miles, FIPK, stock 9B turbos, stock 360cc injectors,
Magnecore wires, .034 plug gap, DSBC @ 14 psi, Alamo DP, test pipe, Borla,
Mobil 1 10W030 oil, Syncroshift in trans, ShockProof Heavy in xfer case,
Centerforce DF clutch, 6-speed Getrag
Jim Matthews' 1994 Dodge Stealth
R/T TT (U.S. Spec)
68K miles, FIPK, stock 9B turbos, stock 360cc injectors,
Magnecore wires, .034 plug gap, SAVC-R @ 1.00 kg/cm^2, stock adjustable exhaust,
Mobil 1 10W40 oil, ShockProof Light in trans, ShockProof Heavy in xfer
case & diff, original stock clutch, 6-speed Getrag
Roger Gerl's 1993 Mitsubishi 3000GT
VR-4 (Euro Spec)
5K miles, FIPK, stock 13G turbos, stock 440cc injectors,
Magnecore wires, .034 plug gap, DSBC @ 14 psi, AFC, ATR DP/cat, Borla,
original stock clutch, 5-speed Getrag
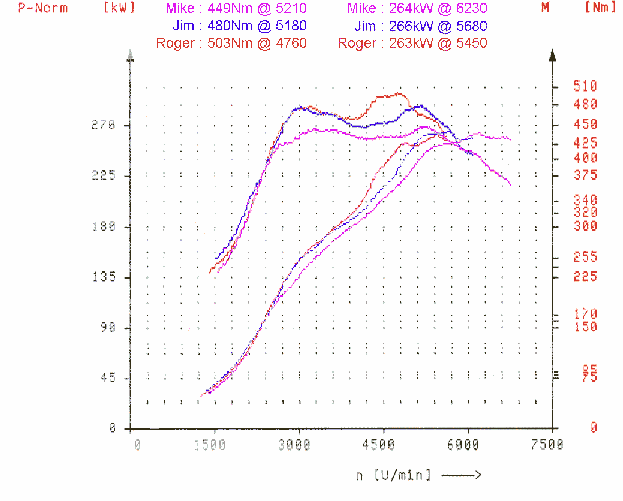
Here is the combined graph for all three cars:

Observations:

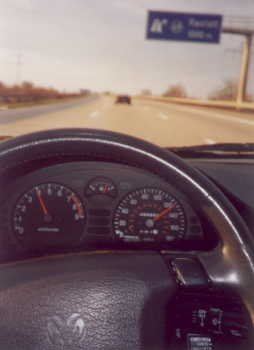
The night before Mike and I made this 250+ mile journey down Autobahn 5 from Frankfurt to Switzerland for dyno testing in Zurich I discovered that one of my front brake pads was completely worn down to the metal. After much discussion and a call to Roger to verify that he had spare pads I could use when (if?) we made it, we decided that we would attempt the trip anyway and just avoid using the brakes! We left early Sunday morning and I followed Mike down so that he could buffer any surprises. Luckily, the Autobahn was very clear that morning and while I did use the parking brake a few times, I only had to touch the brake pedal one time! Our average speed on this trip was still nearly 130 mph; I got up the nerve to take this shot as we slowed upon approaching a merge area. When we arrived in Zurich, my rotor was still in good shape and Roger's Euro-spec pads fit without any problem.